We've all been there. We hit a bug, and after a bit of debugging we determine the cause actually lives in one of Apple's frameworks. 😱Perhaps even worse, we find a crashing bug in Xcode itself 😨. When we hit these types of issues, our first step to getting it fixed should be reporting the bug to Apple. Today we'll check out how to do it. Let's begin.
We'll start by going to bugreport.apple.com and logging in with our developer account Apple ID.
Once inside, we'll see a delightful iOS 6-ish interface. Yeah... Anyways, we'll click the New button to get started.
Next, we'll select the platform/product we're reporting for.
Finally, we'll be shown the main New Problem form. Most of the fields are self explanatory, but don't feel too boxed in by the format. Just be direct, describe the exact problem as we'd want to hear it described ourselves (imagine if we were the ones tasked to fix it!)
Here's a quick example:
Apple's internal “Radar” system for tracking these reports has gotten a bad rep. In truth though, it's our only way to get these types of issues in front of the eyes of the engineers who need to know about them. Now go forth, and report all the things!
It happenstothebest of us. We're going along, composing some UIViews in our app. We're styling them, configuring them, we can't wait to try them out. That's when we see it. A big, empty, unescapable void of nothingness right where our views should be! 😱
Today we'll look at some tips to solve a case of missingUIViews.
First, we should arm ourselves with tools to help inspect what's going on. Xcode's own View Debugger is a great place to start, and Reveal.app is a fantastic third-party solution.
Whether it's one of these tools, or simply writing some in-depth logging functions, our first step should be to look at both our view hierarchy and its layout for anything funky.
We can use private functions like recursiveDescription to print out a handy tree-view of our views to Xcode'sConsole.
Most of these debugging sessions stop here, as the problem often involves a view not being in the correct place in the hierarchy, or Auto Layout has gone and done something wacky with our views' locations.
If we're still stuck though, here are some sanity checks we can perform:
Are any viewshidden?
How about transparent? (0 alpha)
Is it masked via a maskLayer?
Does it have a CGRectZeroframe?
Is the key UIWindow a weird size or in a weird place?
Try making each view a specificuglycolor (the static .XColor() functions on UIColor work wonders here).
Is another view covering it up?
Is .clipsToBounds enabled and a strange frame/bounds is causing the view to be clipped?
If all else fails, comment out everything, and add it back one bit at a time until something fails.
Today we're looking at SwiftyBeaver, a library from Sebastian Kreutzberger that aims to improve Xcode's logging capabilities. Let's dive in.
After adding the library to our project we'll need to import the library in our AppDelegate. We'll also need to create a global log reference we can use throughout our app:
importSwiftyBeaverletlog=SwiftyBeaver.self
Then we'll need to tell SwiftyBeaver to log somewhere, let's set it up to log to Xcode's console and a log file:
SwiftyBeaver is built around the concept of "destinations". Here we're adding one for the Xcode console, then another to log to a file in our app's documents directory.
Now, we can use our global log reference to log messages. There's functions for each of the different levels. Each will log its level in its own color:
log.verbose("Nothing really happened")// graylog.debug("A thing happened")// bluelog.info("A good thing happened")// greenlog.warning("A probably bad thing happened")// yellowlog.error("A definitely bad thing happened")// red
Both built-in destinations have a ton of configuration options allowing us to customize how we'd like our logs to behave. We can customize the format of log statements or change a file destination's location, we can even define our own destinations if needed!
Today we'll take a look at a few handy tips and tricks to know about when debugging.
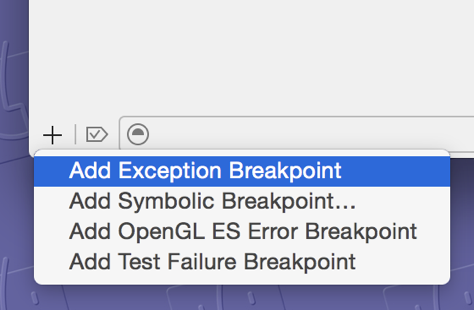
Exception Breakpoint
Make sure to always add an exception breakpoint to every project. Xcode will pause anytime an exception is thrown and let us poke around.
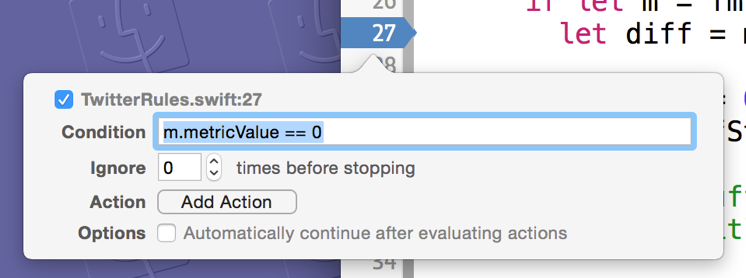
Conditional Breakpoints
Break exactly when we want to.
Evaluate an Expression
With expression or e we can even modify values in our app, and then continue running.
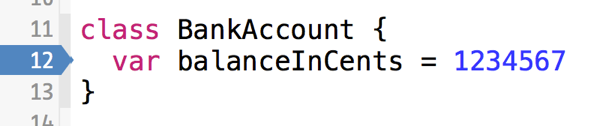
Property Breakpoints
Here's one that is not as widely known as it should be:
If we set a breakpoint on the line of code containing a property definition, our application will pause anytime that property's value is changing and display a stack trace of the function calls that ultimately caused the change.