Measuring the performance of an app is the first step in optimizing it. Lucky for us, Apple's developer tools have plenty of profiling features. Let's take a look at one, Time Profiler. It's claim to fame is helping us fine tune performance by tracking down slow functions.
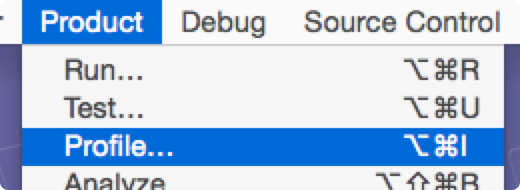
We start by opening our project in Xcode, and selecting Product > Profile from the menu.

![]()
This will build our app, and launch Instruments. When it does, we'll select the Time Profiler Instrument and click Profile. Now the fun part: We click 🔴 in the top left and Instruments will launch our app, and begin measuring its performance. One common way to use Time Profiler is to discover any under-performing functions that might be bogging down our main thread.

Remember, a bored main thread with nothing do is a happy one. Once our app is running, we'll turn on all the Call Tree options. This will clean up the data that's collected making it easier to sift through. We can flip these on and off after profiling to learn about different parts of the code being executed. From here we simply interact with our app, and after a few seconds we'll see data starting to appear. We expand the Main Thread, and see that  a function called
 insertNewObject is at the top of the list, meaning of all the functions that were called, this one caused our main thread to block the most. We'll double click on it to see the exact spot in our code calling the sluggish function, ready for us to optimize:

 Tweet
Tweet
 Share
Share
 on reddit